
Released: 2026-06-15
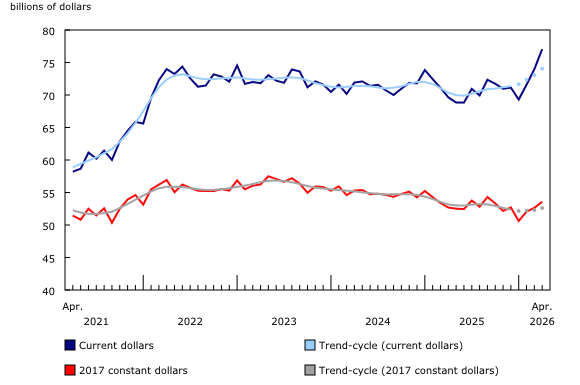
Total manufacturing sales rose 4.2% to $77.1 billion in April, following a 3.4% increase in March. Sales rose in 17 of the 21 subsectors, led by the petroleum and coal product (+22.6%) and food (+2.9%) subsectors. Sales of primary metals (-4.6%) declined the most. Total manufacturing sales excluding petroleum and coal products were up 1.4% on a month-over-month basis in April, while they increased 10.6% on a year-over-year basis.
In constant dollars, total manufacturing sales rose 1.8% in April, while the Industrial Product Price Index increased 2.0%.
Petroleum and coal product subsector leads the sales increase in the manufacturing sector
Petroleum and coal product sales reached another record high in April, rising 22.6% to $11.8 billion, following a 25.5% increase in March. The gain was driven primarily by higher volumes, as sales in constant dollars rose 17.5% in April. Several refineries ramped up production after maintenance shutdowns in March. In addition, the ongoing closure of the Strait of Hormuz, a critical global shipping route for oil, continued to exert upward pressure on energy and petroleum product prices in April, reflecting heightened supply concerns in international markets. On a year-over-year basis, petroleum product sales in current dollars were up 77.1% in April. Meanwhile, exports of refined petroleum energy products (including liquid biofuels) increased 56.3% month over month.
Sales of food products reached their record high, rising 2.9% to $13.9 billion in April. Sales in constant dollars were up 2.4%. Higher sales of grain and oilseed milling contributed the most to the increase. On a year-over-year basis, total sales of food in current dollars increased 5.9%.
In the primary metal subsector, sales fell 4.6% to $6.3 billion in April, following a 0.7% decline in March. Sales decreased in all primary metal industry groups, except foundries, with the largest decline observed in the non-ferrous metal (excluding aluminum) production and processing industry group. Sales of non-ferrous metals had reached a record high in March. Total sales of primary metal in constant dollars were down 6.4% in April.
Chart 1 
Manufacturing sales
Alberta posts the largest increase in manufacturing sales
Sales in the manufacturing sector rose in seven provinces in April, led by Alberta and followed by Quebec. Meanwhile, Manitoba posted the largest decline.
Sales in Alberta rose 16.7% to $10.5 billion in April, the highest level on record. Gains were reported in 15 of the 21 subsectors, led by the petroleum and coal product (+33.1%), food (+22.4%) and chemical (+8.6%) subsectors. Within food manufacturing, the increase was driven by the grain and oilseed milling as well as the meat product industry groups, while the rise in chemical manufacturing sales was largely attributable to increased sales in resin, synthetic rubber, and artificial and synthetic fibres and filaments manufacturing. On a year-over-year basis, total sales in Alberta rose 23.2% in April.
In Quebec, sales rose 4.2% to $20.0 billion in April, the highest level on record, driven largely by higher sales of petroleum and coal products (+24.8%). In contrast, the computer and electronic product subsector posted the largest decline (-15.5%), following six consecutive monthly gains. On a year-over-year basis, total sales in Quebec increased 12.4% in April.
Manitoba recorded the largest decrease in sales in April, down 6.1% to $2.3 billion. This decrease was mainly driven by lower production of aerospace products and parts, along with reduced sales of chemicals. Despite the month-over-month decline, total sales in Manitoba were 10.5% higher in April compared with the same month a year earlier.
Total inventories increase
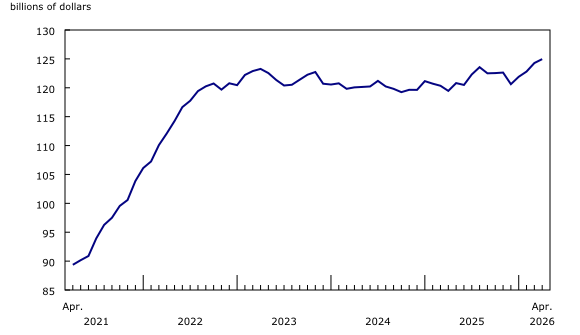
Total inventories rose 0.5% to $125.0 billion in April, with increases in 13 of the 21 subsectors, led by the machinery (+2.2%), petroleum and coal products (+2.7%), and transportation equipment (+0.8%) subsectors. The overall gain was driven by higher inventories of goods in process (+1.4%) and finished products (+0.7%), while raw material inventories edged down 0.1% in April.
Chart 2
Total inventories increase in April
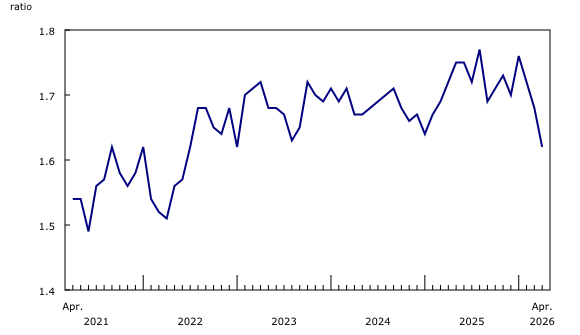
The inventory-to-sales ratio declined from 1.68 in March to 1.62 in April, the lowest since January 2023. This ratio measures the time, in months, that would be required to exhaust inventories if sales were to remain at their current level.
Chart 3
The inventory-to-sales ratio decreases in April
Unfilled orders increase
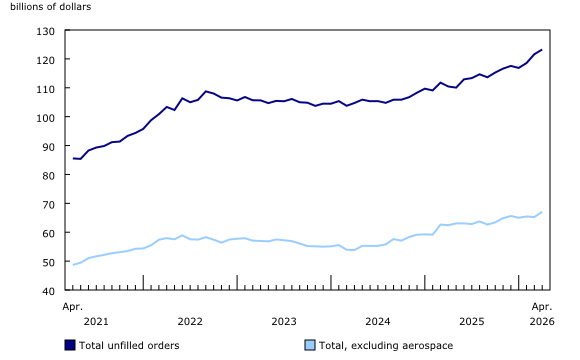
Unfilled orders reached another record high in April, rising 1.3% to $123.2 billion. The increase was driven mainly by higher unfilled orders in the transportation equipment (+1.1%) and primary metal (+15.3%) subsectors. These gains were partially offset by a decline of 3.5% in unfilled orders of fabricated metal products.
Chart 4
Unfilled orders increase in April
Capacity utilization rate declines
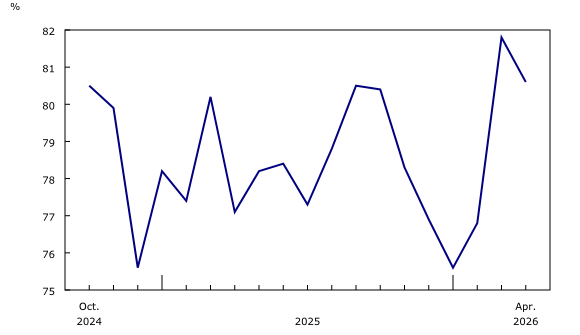
The capacity utilization rate (not seasonally adjusted) for the total manufacturing sector fell from 81.8% in March to 80.6% in April. The declines were most pronounced in the petroleum and coal product (-4.2 percentage points), primary metal (-3.8 percentage points) and machinery (-2.4 percentage points) subsectors. In contrast, the capacity utilization rate in the non-metallic mineral product subsector rose 4.4 percentage points during the same period.
Chart 5
Capacity utilization rate decreases in April
https://www150.statcan.gc.ca/n1/daily-quotidien/260615/dq260615a-eng.htm
.png)